

Free sales tracker template
for Excel and Google Sheets
Download it below. It works out your weighted pipeline for you, and it flags any deal you haven't touched in two weeks. No email, no signup.
What's in it
Four working tabs. Nothing to set up.
Weighted pipeline, automatically
Pick a stage and the sheet fills in the win probability and the weighted value. You get a forecast without building one.
It tells you what's gone quiet
Any open deal untouched for 14 days turns amber, 30 days turns red. Overdue next steps turn red too.
An activity log that ties to deals
A second tab for calls, meetings and emails, so history lives somewhere other than your inbox.
A summary tab you don't maintain
Deal count, value and weighted value per stage, plus a short list of what needs attention this week.
How to use it
1. Open it
Excel and Numbers open it directly. For Google Sheets: File → Import → Upload. Formulas, dropdowns and colour rules all survive the trip.
2. Replace the six sample deals
They're there to show you what filled-in looks like. Delete them and put your own in. Pick stages from the dropdown and the maths takes care of itself.
3. Update two columns, always
Next step and Last activity. Everything useful the sheet does is built on those two. Then read the summary tab on Monday.
What goes in each column
Useful even if you'd rather build your own from scratch.
- Deal
- What you're selling them.
- Company
- Who's buying.
- Owner
- Whose deal it is. Matters the moment there are two of you.
- Stage
- Dropdown. Drives probability and the whole summary tab.
- Value
- Full contract value, not monthly.
- Probability
- Filled in from the stage. Edit the Lists tab to change it.
- Weighted value
- Value × probability. Your realistic forecast.
- Source
- Where it came from. Tells you what to do more of.
- Next step
- The single most important column. A deal with no next step is a dead deal.
- Next step due
- Turns red when it's overdue.
- Expected close
- Your best guess at a date.
- Last activity
- Update this every time something happens.
- Days quiet
- Counts itself. Colours itself. Your nudge list.
- Notes
- Everything else.
When the spreadsheet stops working
It usually happens twice, and both times for the same reason: a spreadsheet remembers numbers, not what happened.
The second person
Someone sorts a column, someone else overwrites a formula, a third person is working from a copy they downloaded last month. Nobody trusts the number.
The one-cell memory
"Last activity" is a single date. The three calls, the demo and the reason they went quiet are in your inbox, your head, or gone.
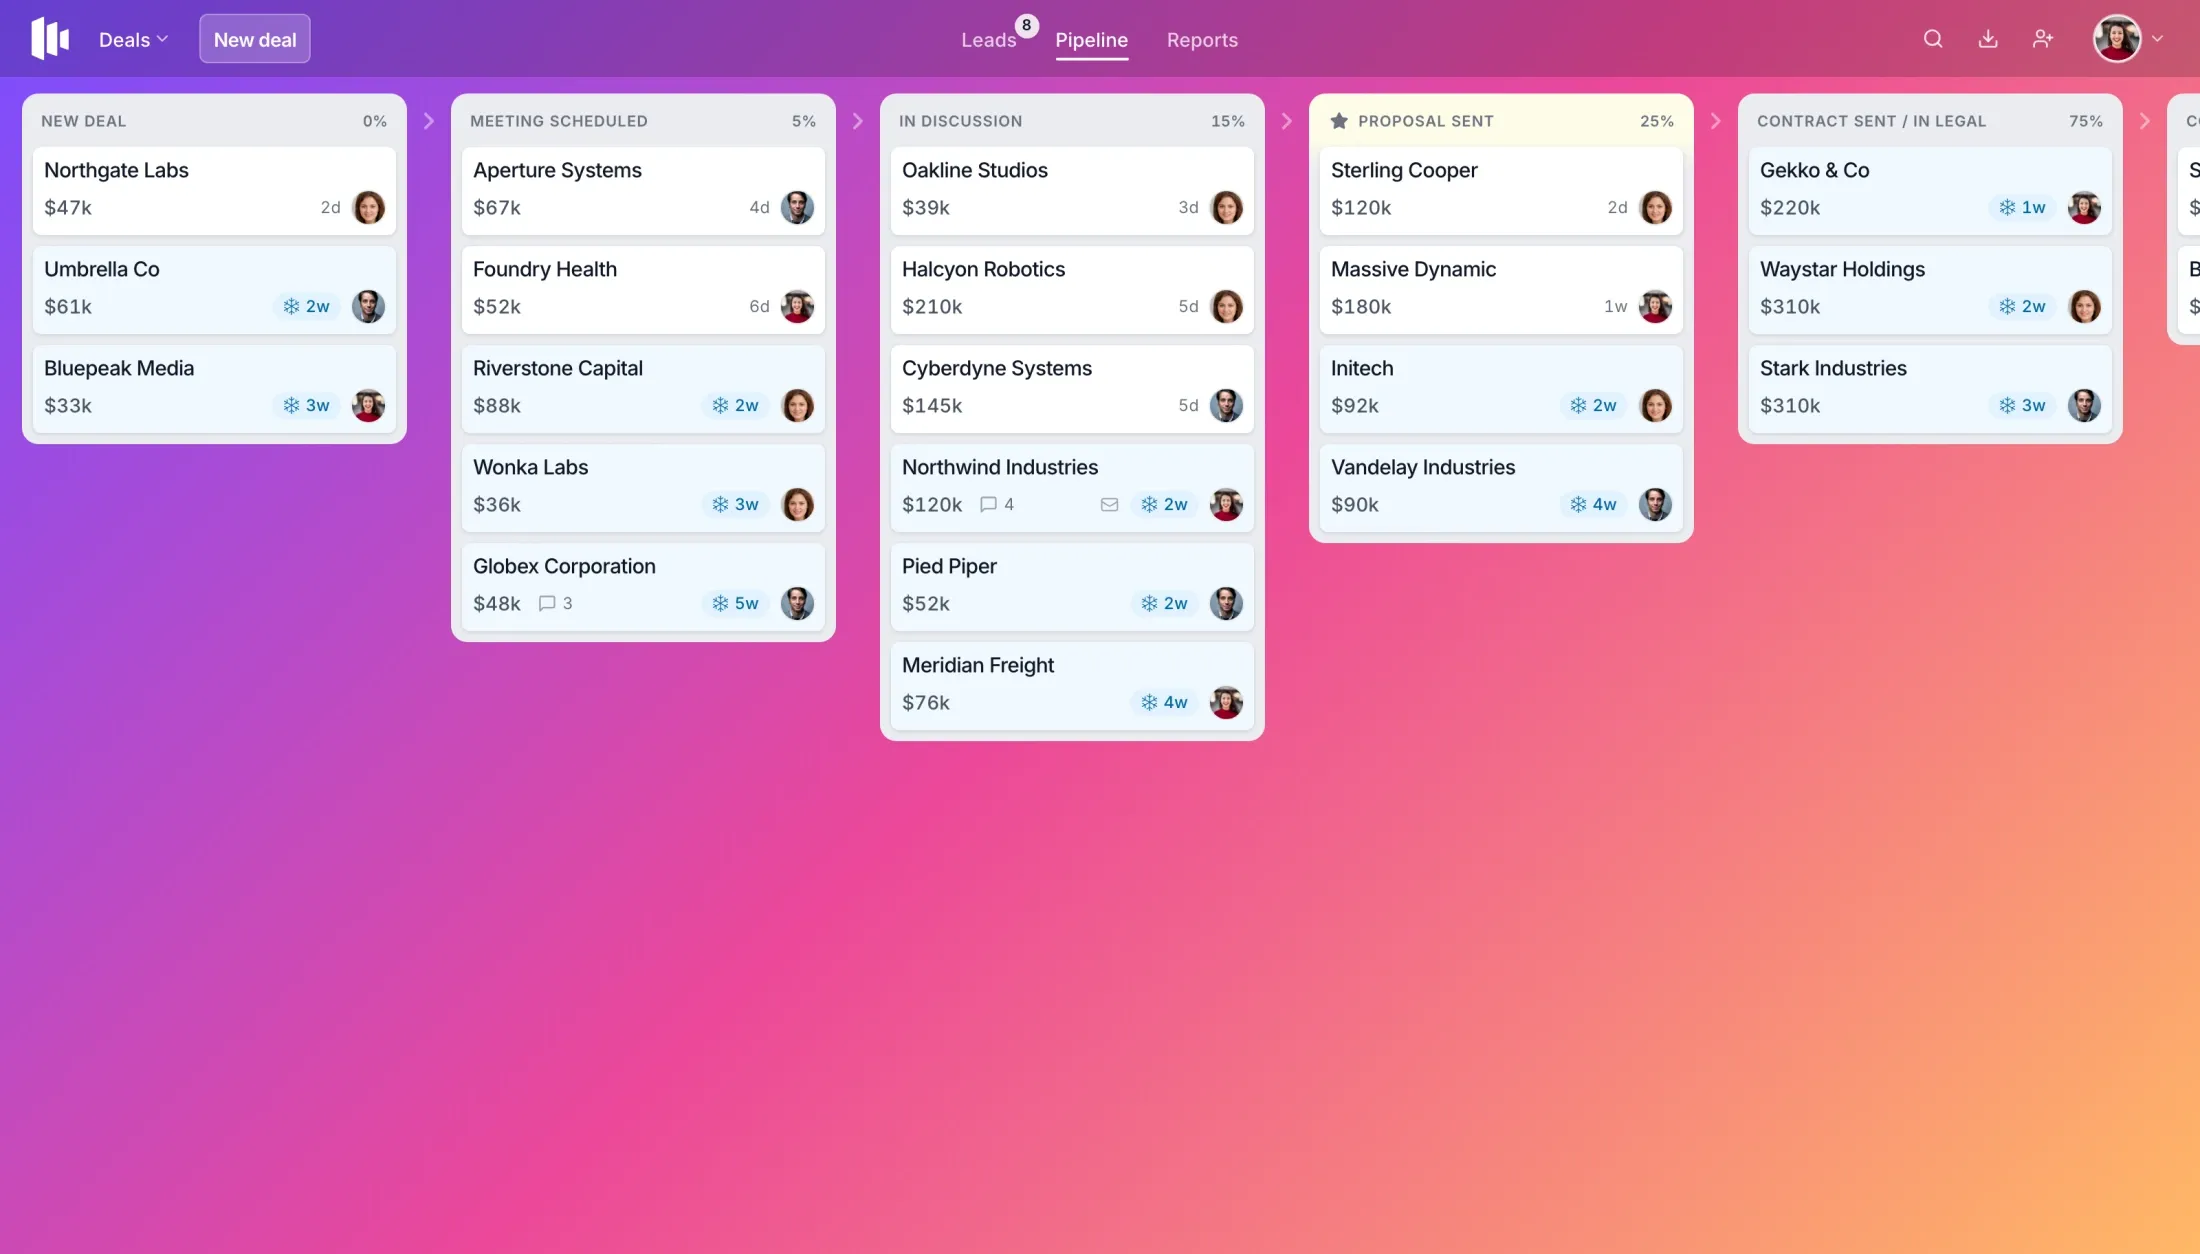
The same stages as the template, as a board. Notes stay attached to the deal.
One person, a handful of deals, and you look at it every day? The template is genuinely enough — that's why we made it good and gave it away. Come back when you're sharing it.
Sales tracker questions, answered
Is this sales tracker template really free?
Yes. Download the .xlsx directly — no email address, no account, no trial. It's a normal spreadsheet file. Use it, change it, share it with your team.
Does it work in Google Sheets?
Yes. In Google Sheets go to File → Import → Upload and drop the .xlsx in. Formulas, dropdowns and colour rules all carry over. It also opens in Excel, Numbers and LibreOffice.
What should a sales tracker actually contain?
At minimum: the deal, the company, the stage, the value, the next step, and the date of the last activity. The next step and last activity columns are the ones that matter — most deals are lost to silence rather than to a competitor. The rest is optional detail.
How is a sales tracker different from a CRM?
A sales tracker records deals and what happened to them. A CRM adds a contact database, email sequences, automations, permissions and reporting — and needs configuring. Most teams under about ten people need a tracker, not a CRM. That's why this template exists.
How do I calculate weighted pipeline value?
Multiply each deal's value by the win probability of its current stage, then add them up. The template does it for you: the defaults are 10% at New Deal, 25% Meeting Scheduled, 40% In Discussion, 60% Proposal Sent, 85% Contract Sent. Replace those with your own win rates on the Lists tab once you have enough history to know them.
When should I stop using a spreadsheet for sales?
Usually at one of two moments. The first is when a second person needs to edit it — spreadsheets have no real multi-user story, and you end up with conflicting copies. The second is when one "Last activity" cell stops being enough and you want the actual history of a deal. At that point a purpose-built tracker costs you less time than maintaining the sheet.
Can I change the stages?
Yes, and you should. Edit the Lists tab — the dropdowns, the probabilities and the summary tab all follow along. The defaults are the stages Dealboard ships with, which is a reasonable starting point for most B2B pipelines.
Outgrown the sheet?
Try the board.
Same stages, drag-and-drop, notes that stay attached. Free for 30 active deals and unlimited teammates.
Also useful: what your CRM really costs · what a sales tracker is · pricing